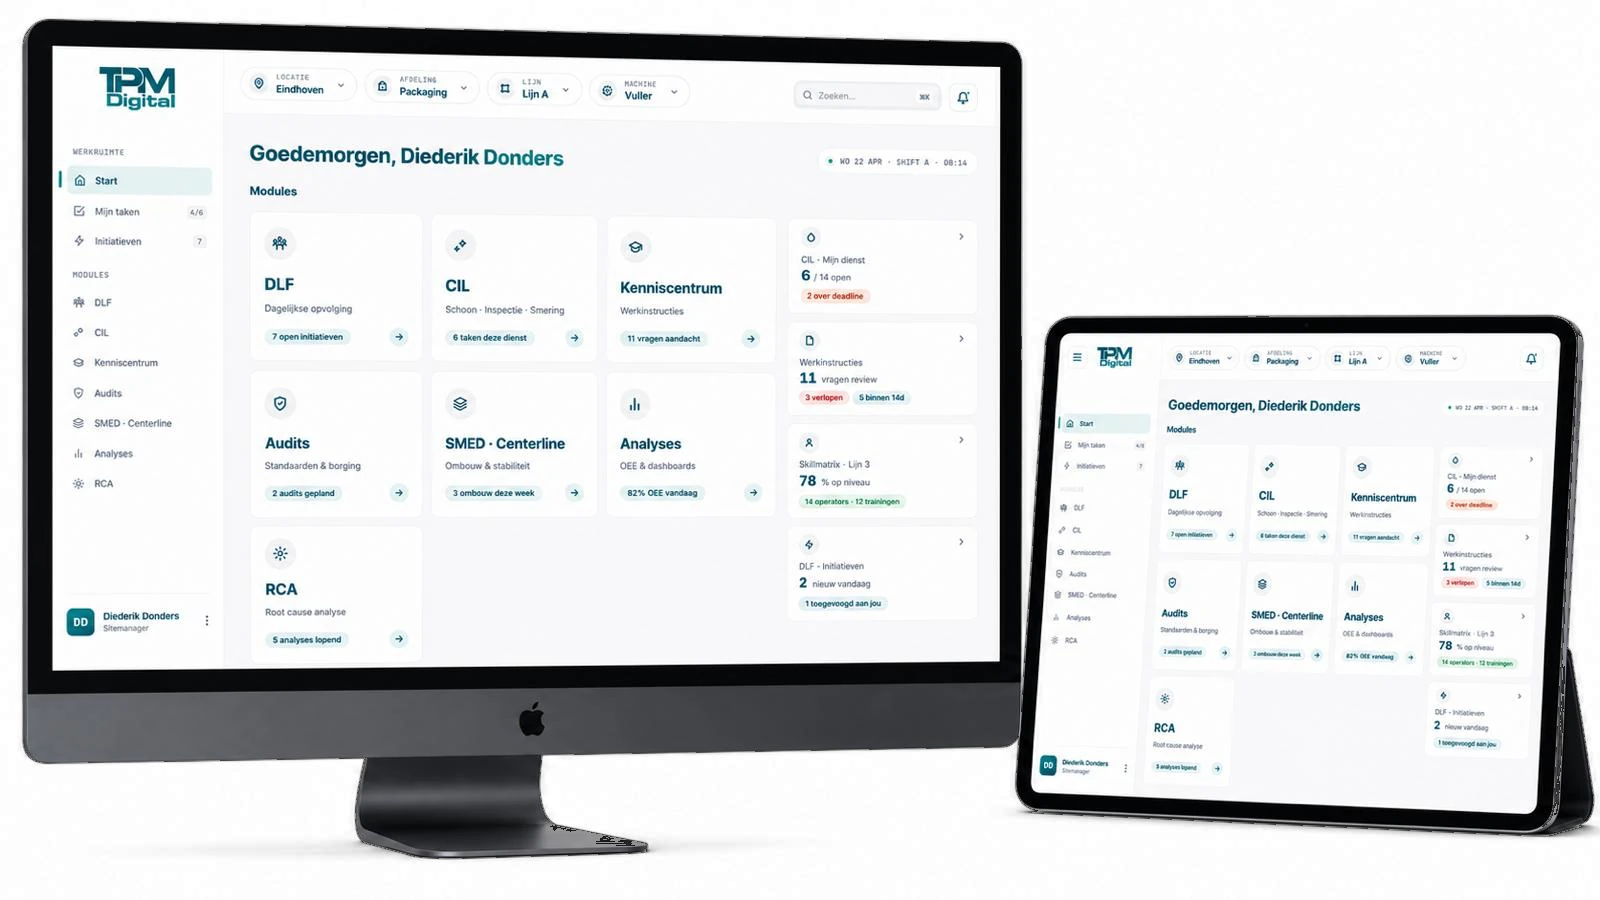
Improvement starts with insight. Analytics shows what's happening in the operation: losses, performance, trends and progress. Real time, tailored and connected to tools such as Power BI.
How Analytics works
01
Data insight
The right data at the centre, in real time and in one place.
02
Tailored dashboards
Power BI connections, KPIs and processes aligned with your organisation.
03
Steering on improvement
Managers steer specifically on deviations and results.
04
Grows with you
Smarter insights and better decisions as more data comes in.
“Insight without sustainment is temporary. TPM Digital makes it structural.”
Analytics
What it delivers
- One version of the truthNo more scattered Excel versions. Everyone works with the same data.
- Faster decisionsReal-time dashboards instead of last week's report.
- Open dataConnections with Power BI and your existing BI environment, without lock-in.